In the fast-paced world of online retail, launching an e-commerce campaign is just the first step. The real challenge lies in determining whether your efforts are paying off. Without a clear and structured approach to measuring success, you risk wasting resources, missing opportunities, and falling behind competitors. But with so many metrics and tools available, how do you know what really matters? This guide will walk you through how to properly measure the success of your e-commerce campaign, offering practical insights, specific data points, and actionable strategies to ensure you’re on the right path.
Understanding Success in E-Commerce Campaigns
Defining “success” in e-commerce isn’t as simple as counting sales. Today’s e-commerce environment requires a multi-dimensional approach. While revenue is a critical measure, it’s not the only one. For instance, a campaign that dramatically increases website traffic but results in few conversions may not be as successful as one that brings in fewer visitors who actually complete purchases.
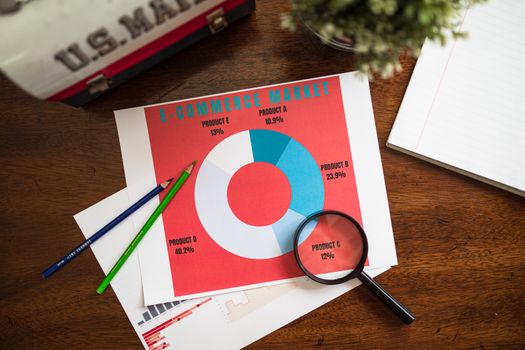
According to Statista, global e-commerce sales reached $5.8 trillion in 2023, with digital ad spending by retailers accounting for over $75 billion. With such high stakes, it’s essential to look beyond vanity metrics (like page views or social media likes) and focus on the indicators that directly impact your business goals. These typically include conversion rates, customer acquisition costs, average order value, return on ad spend, and customer retention metrics.
.png)
Success, ultimately, should be tied to your objectives—whether that’s boosting first-time buyers, increasing repeat purchases, growing your email list, or expanding into new markets.
Key Metrics to Track for E-Commerce Campaigns
Let’s break down the most essential metrics for measuring e-commerce campaign performance:
1. Conversion Rate This metric measures the percentage of visitors who take a desired action, such as making a purchase or signing up for a newsletter. According to IRP Commerce, the average global e-commerce conversion rate in 2023 was 2.3%. A high conversion rate indicates that your campaign is attracting the right audience and your website is effectively persuading them to act. 2. Revenue and Average Order Value (AOV) Revenue is the total income generated from sales, while AOV represents the average amount each customer spends per order. Tracking both helps you assess if your campaign is attracting high-value customers and if your upselling or cross-selling strategies are working. 3. Customer Acquisition Cost (CAC) CAC reveals how much you’re spending to acquire each new customer. If your CAC is higher than your profit per customer, your campaign isn’t sustainable in the long run. According to Shopify, the average CAC for e-commerce businesses ranges between $45 and $150, depending on the industry and advertising channels. 4. Return on Ad Spend (ROAS) ROAS measures how much revenue you generate for every dollar spent on advertising. For example, a ROAS of 4:1 means you earn $4 for every $1 spent. The ideal ROAS depends on your margins, but most e-commerce businesses aim for at least 3:1. 5. Customer Retention Rate Retaining existing customers is often more cost-effective than acquiring new ones. Bain & Company reports that increasing customer retention by just 5% can boost profits by 25-95%. Monitoring repeat purchase rates and customer lifetime value can reveal whether your campaign builds lasting relationships.Choosing the Right Tools for E-Commerce Campaign Measurement
Measuring campaign success requires reliable data—and that means using the right tools. Here are some of the most popular and effective platforms for e-commerce analytics:
- Google Analytics: Provides comprehensive tracking of website traffic, user behavior, conversion funnels, and e-commerce transactions. Enhanced E-commerce features allow you to analyze product performance, cart abandonment, and more. - Facebook Ads Manager: Essential for tracking ad performance, audience demographics, and ROAS for campaigns run on Facebook and Instagram. - Shopify Analytics: If you use Shopify, built-in analytics give detailed insights into sales, traffic, conversion rates, and customer behavior. - Klaviyo or Mailchimp: For email campaigns, these platforms track opens, clicks, conversions, and revenue per campaign. - Hotjar or Crazy Egg: These tools offer heatmaps and session recordings to understand how users interact with your site.With these tools, you can gather both quantitative data (sales, clicks, traffic) and qualitative insights (user journeys, on-site obstacles) to get a complete picture of your campaign’s effectiveness.
Analyzing and Interpreting Data: Avoiding Common Pitfalls
Collecting data is only the first step; interpreting it correctly is crucial. One common mistake is focusing on a single metric in isolation. For example, a spike in website visits might look impressive, but if it doesn’t translate to sales, the campaign may need adjustment.
Another pitfall is ignoring the context behind the numbers. Seasonality, external events, or changes in ad spending can impact performance. Always compare your campaign metrics to historical data, industry benchmarks, and your own targets.
Here’s a comparative table showing how different metrics can tell different stories:
| Metric | Scenario A | Scenario B | Interpretation |
|---|---|---|---|
| Website Traffic | +50% | +10% | Scenario A attracts more visitors, but is that quality traffic? |
| Conversion Rate | 1.2% | 3.1% | Scenario B has fewer visitors but more buyers per visit. |
| Revenue | $8,000 | $12,000 | Scenario B generates more revenue with less traffic. |
| Customer Acquisition Cost | $90 | $55 | Scenario B is more cost-effective per customer. |
This table demonstrates why looking at a combination of metrics provides deeper insight into your campaign’s true performance.
Setting Realistic Benchmarks and Goals
To measure success effectively, you must set clear goals and benchmarks before launching your campaign. These should be SMART: Specific, Measurable, Achievable, Relevant, and Time-bound.
For example, instead of simply aiming to “increase sales,” set a goal like: “Increase revenue from new customers by 20% over the next quarter, while maintaining a ROAS of at least 3:1.” Industry benchmarks can guide your expectations. For instance:
- Average cart abandonment rate: 69.99% (Baymard Institute, 2023) - Average e-commerce email open rate: 15-25% - Average mobile conversion rate: 1.8%Compare your results to these figures and your own historical data to determine whether your campaign is lagging, meeting, or exceeding industry norms.
Iterating and Optimizing Based on Results
Measuring campaign success isn’t a one-time activity. The most successful e-commerce brands treat it as an ongoing process of learning and optimization. After you analyze your results, take these steps:
1. Identify what worked: Which channels or messages delivered the best ROAS or conversion rates? 2. Pinpoint weaknesses: Were there stages in your funnel with high drop-off rates? Did certain segments respond poorly? 3. Test improvements: Run A/B tests on landing pages, ad creatives, or email sequences to see what lifts performance. 4. Refine your targeting: Use insights about demographics, interests, and behaviors to hone your audience. 5. Monitor over time: Track changes month-to-month or campaign-to-campaign, looking for positive trends or recurring issues.For example, if you discover that 80% of your traffic is coming from mobile devices but your mobile conversion rate is lagging at 1%, prioritize mobile site speed and checkout optimization. If email campaigns drive the highest repeat purchases, invest in segmentation and personalized messaging.
Final Thoughts on Measuring E-Commerce Campaign Success
Properly measuring the success of your e-commerce campaign requires a holistic, data-driven approach. It’s not just about tracking sales, but about understanding the entire customer journey—from the first ad impression to the final purchase and beyond. By focusing on meaningful metrics, leveraging the right tools, setting clear benchmarks, and continuously optimizing based on data, you can ensure your campaigns drive real, sustainable growth.
Remember, the most successful e-commerce brands aren’t those with the biggest budgets—they’re the ones who know exactly what’s working (and what’s not) so they can adapt quickly, serve their customers better, and outpace the competition.